Jul 22, 2026
The Anatomy of a Semantic Layer
“Your data sources have a surface. Your BI tool has a surface. The layer that makes them agree has none — so it gets skipped. Here's the anatomy of the translator you can't see.”
Two things in your data stack have a face. Your data sources have one — tables you can query, columns you can list, a schema you can open and read. Your BI tool has one — dashboards, charts, the filter bar everyone clicks. You can point at both. You can screenshot them.
Between them sits a third thing that does the most important job and has no face at all. It's the reason the same word means the same number on every screen — or the reason it doesn't. Most teams have never drawn it, because there's nothing to screenshot. That's the semantic layer, and this is its anatomy.
The two surfaces, wired straight together
For most of the history of analytics, we connected those two faces directly. The dashboard reaches into the warehouse, writes some SQL, and paints a chart. One report, one query, done.
It works beautifully — for one report. Then you build the second, and someone writes "revenue" a little differently. By the tenth report, "revenue" means five things, "active customer" means three, and the fiscal calendar is hard-coded in four places. Nobody broke anything on purpose. Each report just re-derived the logic from scratch, and the definitions quietly forked.
That's the failure mode of wiring the surface layer straight to the data layer: it doesn't survive scale. Every new report is a new place for the meaning to drift.
The layer with no surface
The fix isn't a better dashboard or a cleaner warehouse. It's a translator that sits between them — one place where the business's language is defined once, so every surface reads the same meaning from the same source.
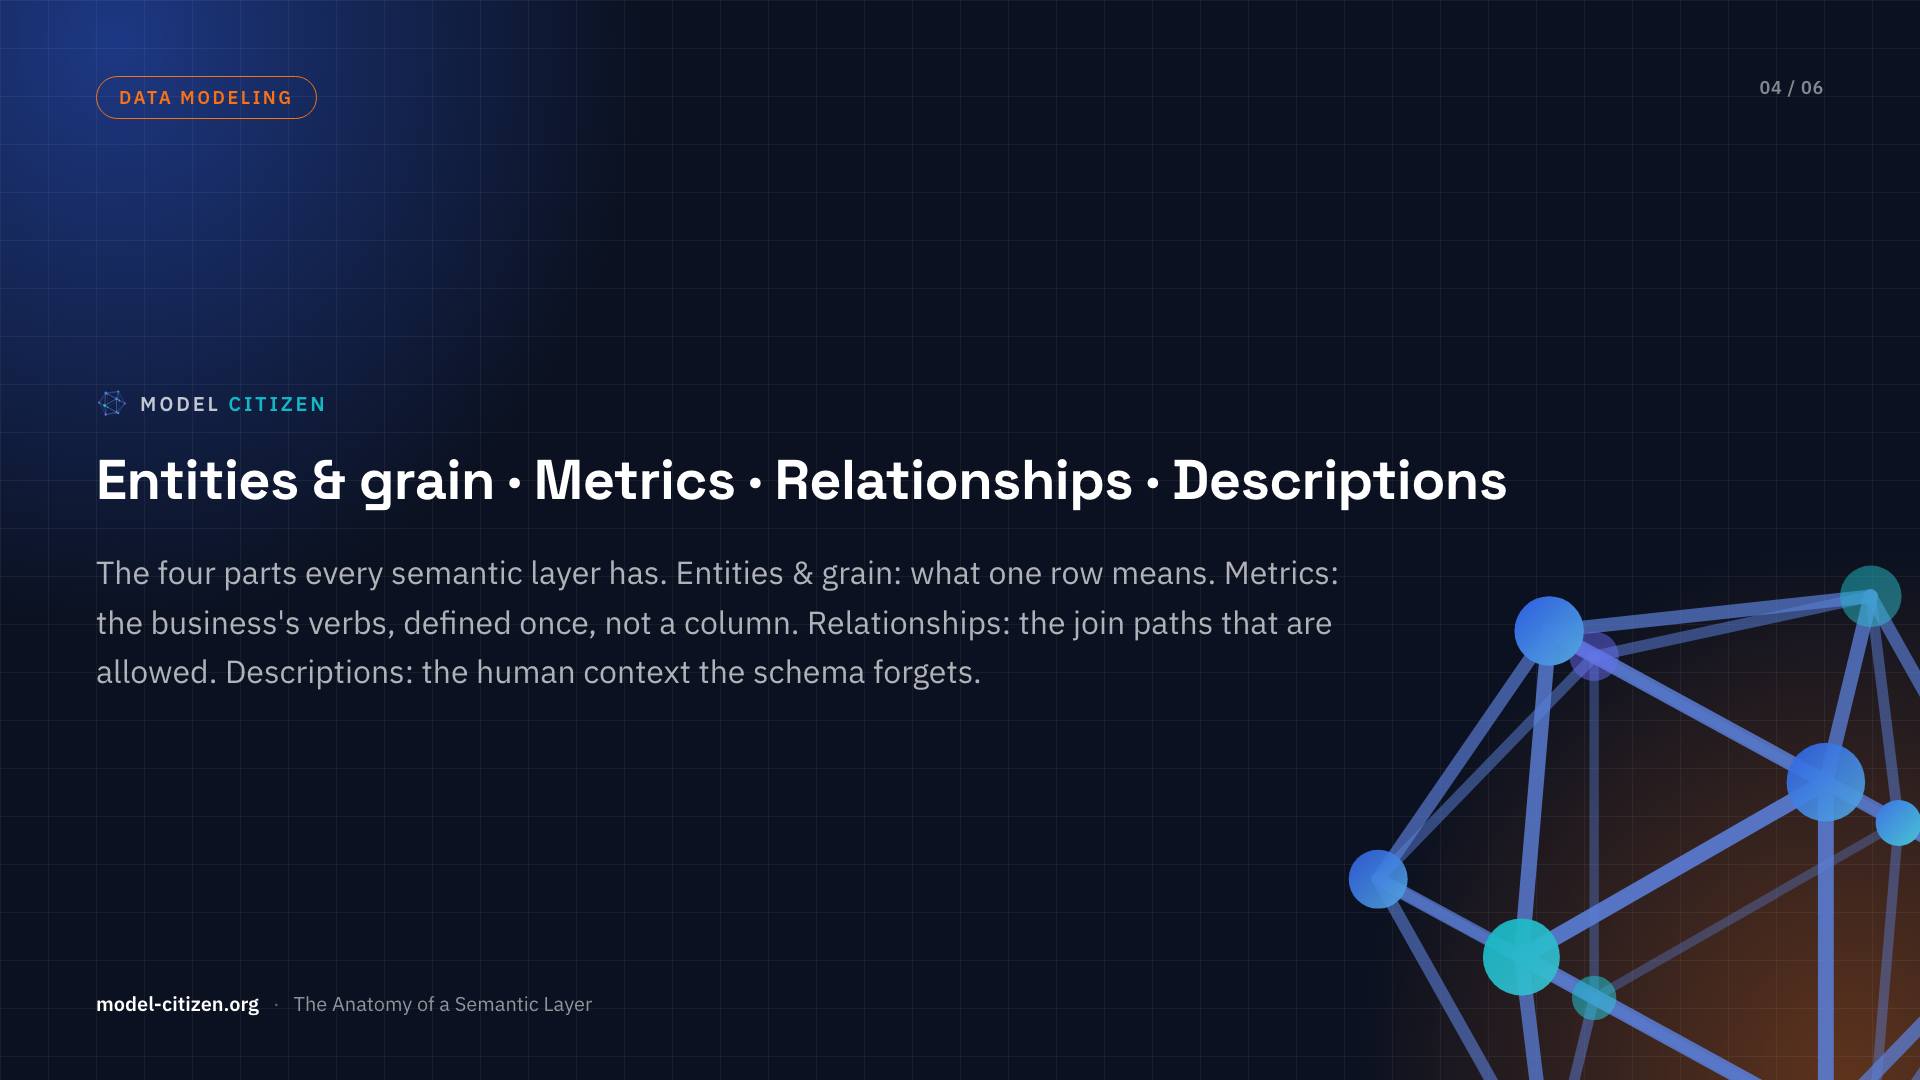
That translator is the semantic layer. And the reason it gets skipped isn't that people don't value it — it's that they can't see it. A source has a surface; a BI tool has a surface; the semantic layer has none. It's the load-bearing wall behind the drywall. So let's give it an anatomy — the four parts every semantic layer has, and what each one translates.
Entities and grain — what one row means
Start with the nouns. An entity is the thing you count — a customer, an order, a session — and its grain is what a single row represents: one order, or one order line? Get that wrong and every sum downstream is wrong. The semantic layer pins the grain once, so "customer" means the billing account everywhere — not the billing account here and the user over there.
Metrics — the business's verbs, defined once
A metric is a definition, not a column —
net_revenue is "amount, minus refunds, minus tax," written down in one governed
place. Defined here, it can't be re-derived three ways in three reports. The
dashboard stops carrying the logic; it just asks for the number.
Relationships — the join paths that are allowed
The warehouse has hundreds of possible joins, and most of them are wrong. Relationships declare the valid paths — how orders connect to customers, how tickets connect to accounts — so neither an analyst nor an AI agent can invent a join that quietly doubles the count.
Descriptions — the context the schema forgets
A column named fct_txn tells a machine nothing. Descriptions carry the human
context — "excludes internal test accounts," "status C means complete" — the
knowledge that used to live only in the head of the one analyst who'd been there
longest. Written down, it's what lets a newcomer or a model read the model
correctly.
What you get for drawing it
Put the four together and the two surfaces finally work as a pair. Define a thing once and use it anywhere — every report, every export, every AI answer inherits the same meaning for free. The surface gets simpler because it stops carrying logic; the data layer gets calmer because there's one place to change a definition, not forty.
That's the whole trick, and it's why the semantic layer is worth seeing even though it has no surface of its own. The tools will keep changing. The anatomy won't.
Below, you can see it built — the two surfaces, the direct wiring that breaks at scale, and the translator between them — as an interactive anatomy.
Watch the deep dive